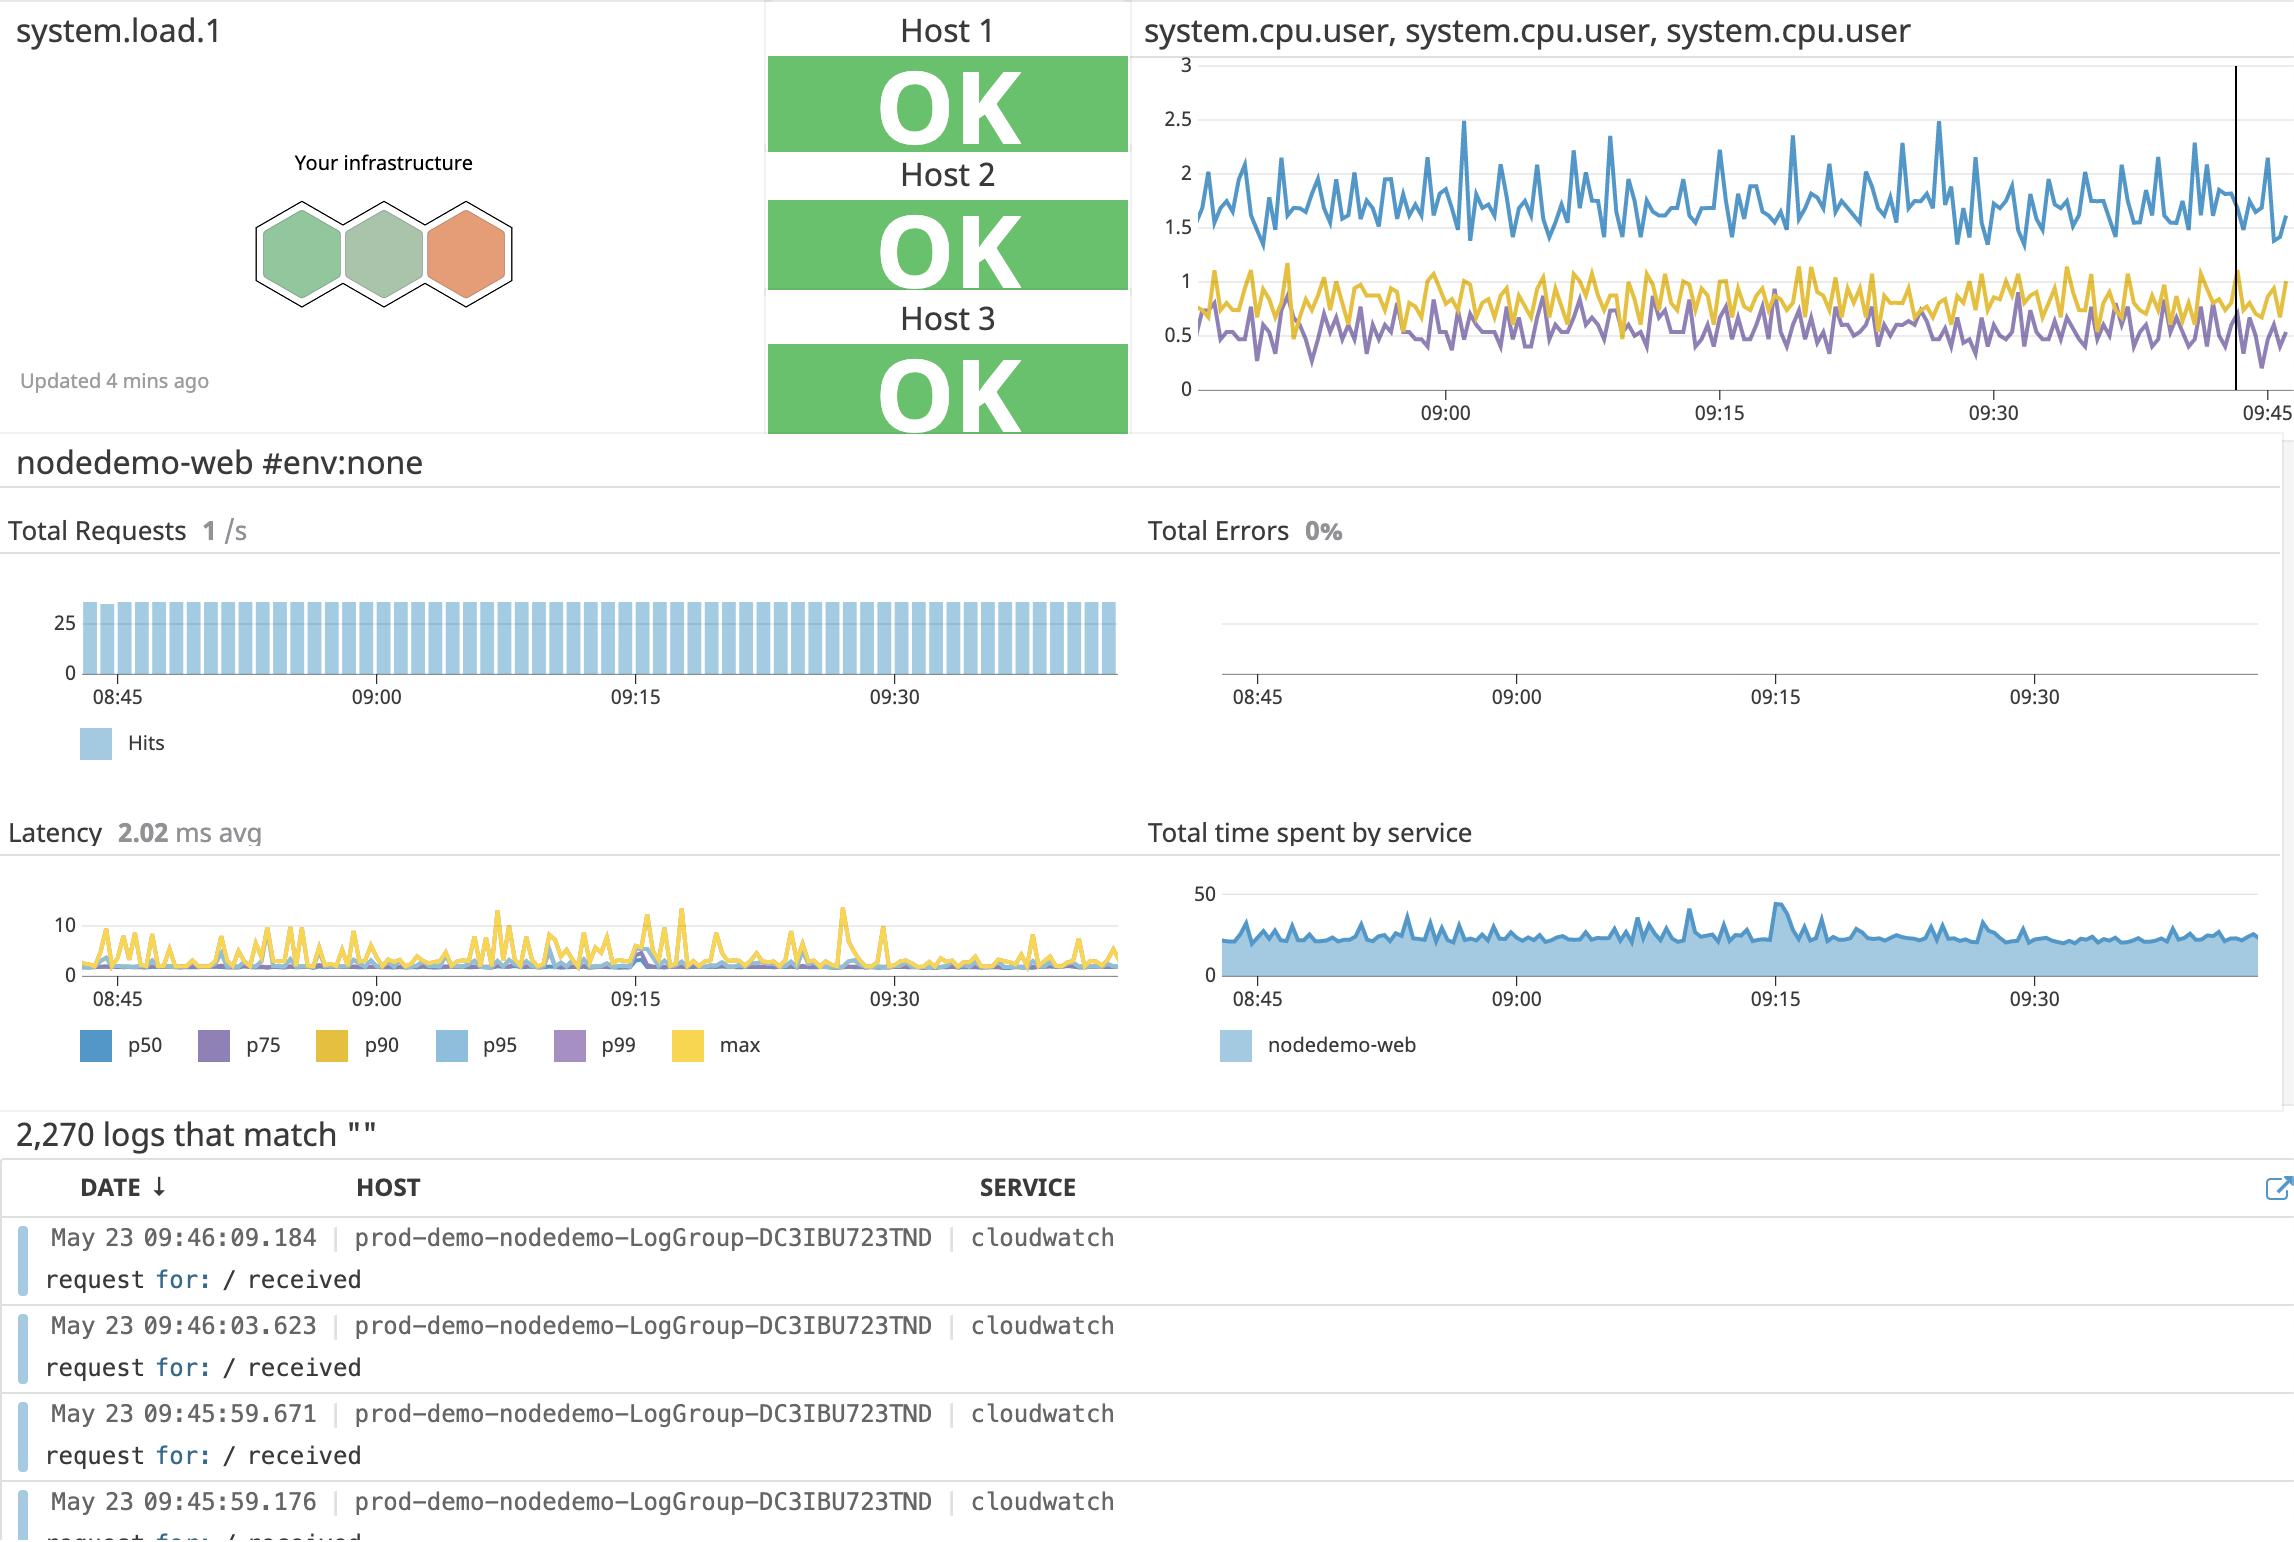
We are big fans of Datadog at Convox and we loved their blog post on monitoring ECS. Reading this post also made me think, “Convox could make this even easier!” So that’s what we did. If you want to deploy a fully instrumented app on ECS follow these instructions and in just a few minutes you will:
-
Run a Datadog agent on every one of your hosts
-
Have full application level monitoring with traces
-
Route all your logs into Datadog

This post assumes you already have a running application on Convox. If you don’t, check out our getting started guide. You will have your first app up and running in no time.
Running a Datadog Agent on Every Host
To achieve maximum visibility we recommend running one copy of the Datadog agent on each EC2 instance powering your ECS cluster. Fortunately Convox makes this easy using the Agent attribute in your convox.yml. To do this simply create a new Convox app with the following convox.yml:
services:
  datadog:
    agent:
      ports:
        - 8125/udp
        - 8126/tcp
    image: datadog/agent:latest
    environment:
      - DD_API_KEY
      - DD_APM_ENABLED=true
      - DD_PROCESS_AGENT_ENABLED=true
      - DD_AC_EXCLUDE="name:datadog-agent name:ecs-agent"
    privileged: true
    scale:
      cpu: 128
      memory: 128
    volumes:
      - /sys/fs/cgroup/:/host/sys/fs/cgroup/
      - /proc/:/host/proc/
      - /var/run/docker.sock:/var/run/docker.sock
You will need to add your Datadog API key as an environment variable which you can do with
$ convox env set DD_API_KEY=[YOUR API KEY]
Once you add this to your convox.yml and deploy your application into the Convox Rack that contains the other apps you want to monitor. You should start seeing your containers appear in Datadog within a few minutes.
A few notes:
This configuration assumes you want to enable APM and live process monitoring. You can disable these if you choose not to use them. We also added:
DD_AC_EXCLUDE="name:datadog-agent name:ecs-agent"
To cut down on the noise from the Datadog and ECS agents. If you want to see their activity you can remove them from the exclude list.
Adding Datadog APM to Your App
In order to really gain insight into how your apps are performing, and particularly where in your code there may be performance issues, it’s recommended to install an Application Performance Monitoring (APM) tracing library in your application. Installing the Datadog APM for an application deployed with Convox is a simple.
All you need to do is install a Datadog tracing library for whatever language/framework your application is based on. You can get very in depth with Datadog tracing but to get basic visibility typically is only a few lines of code. Using a node.js app as an example setting up the Datadog tracer would look like this:
const tracer = require('dd-trace')
var getDockerHost = require('get-docker-host');

   getDockerHost((error, result) => {
        if (result) {
            const tracer = require('dd-trace').init({
                hostname: result,
                port: '8126'
            });
    });
One thing to note is that we are using the get-docker-host module to retrieve the host address. In order to send our APM data to the host we need to use this address. Currently for ECS the host gateway address is defaulted to 172.17.0.1 so you could hardcode for now but there is no guarantee that AWS wont change this in the future. The safest thing to do is grab the address with:
$ ip route list match 0/0 | awk '{print $3}'
Or whatever the equivalent is for your language/framework like we have done with node above. Once you have your application updated you can redeploy it into the Rack where you deployed the Datadog agent application and you will begin to see data in the Datadog APM console.
Routing Your Convox Logs Into Datadog

The final piece is to route all the logs from your application as well as your infrastructure into Datadog. Convox is already configured to route all logs into Cloudwatch and Datadog has a Cloudwatch Lambda function so the configuration is very easy.
The first thing you want to do is to install the Datadog Cloudwatch Lambda function which you can get from either the AWS serverless repository or from Datadog’s github repository.
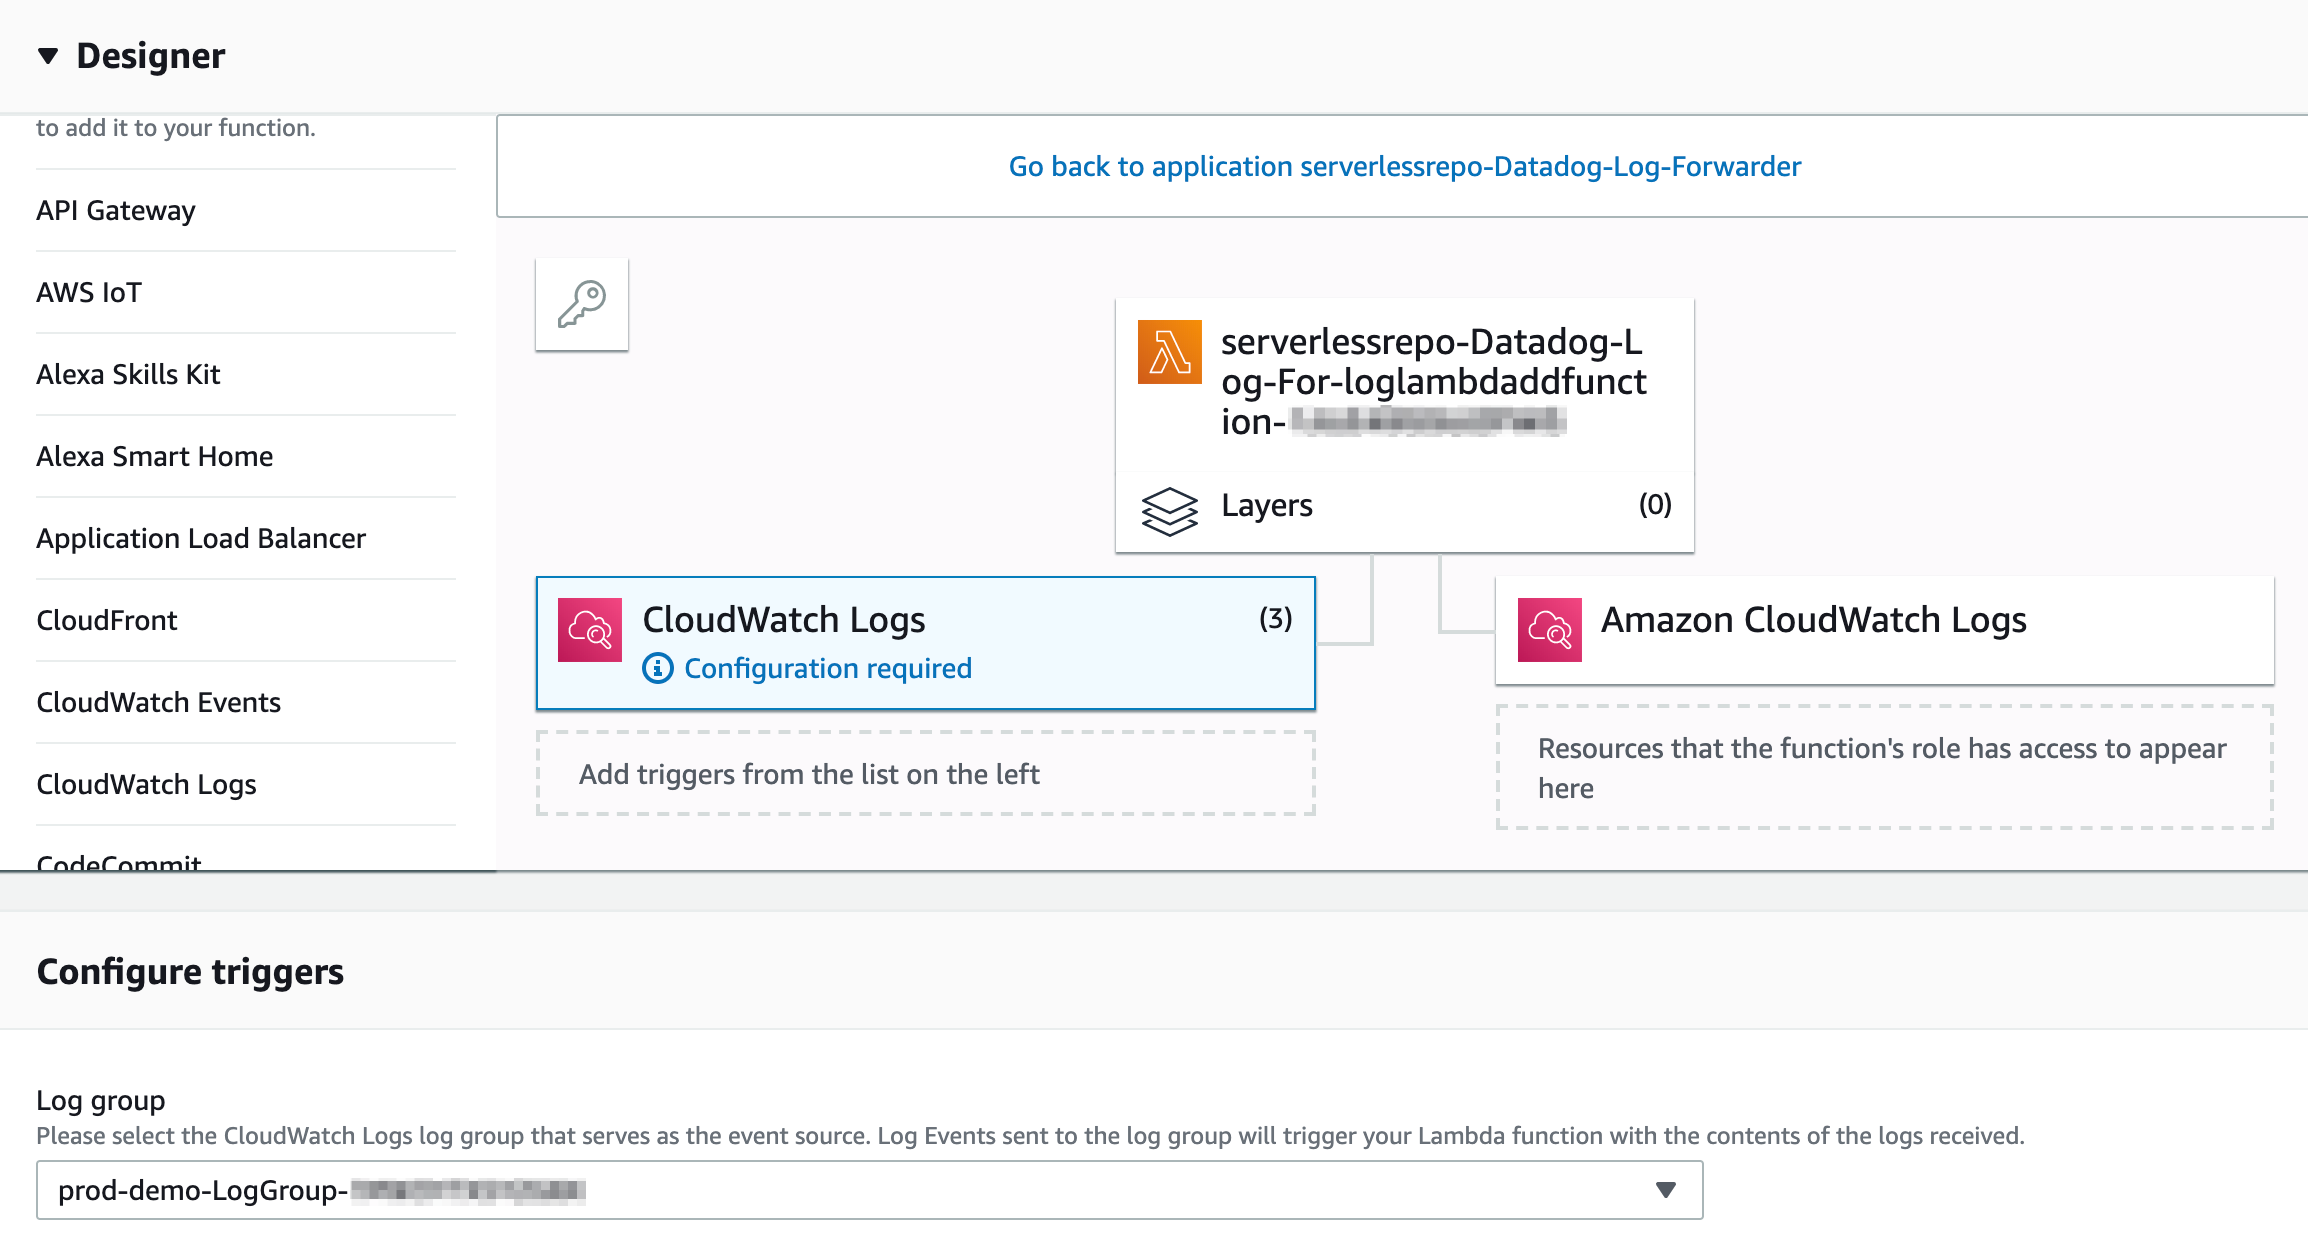
Once you have the Lambda function installed you need to grab your logs from Convox by selecting Cloudwatch from the Add Triggers menu on the left-hand side of the Lambda designer window. From the log group drop down you first want to find the log group that corresponds to your Convox Rack which will be named something like RackName-Log-Group-XXXXX. Next you will want to add the log group for your app(s) The application log group names will look like RackName-AppName-Log-Group-XXXXX. You can verify you have the correct log groups by going into Cloudformation and checking the outputs for your Rack and App stacks. You will want to repeat this step for each application in your Rack that you wish to capture the logs for. Once you have added all the log groups click save and you are good to go. You can head over to the logs live tail view in your Datadog console and see your logs streaming in. If you want to rename services or otherwise customize your logs you can do so with a log pipeline by clicking on configure in the logs menu.
With this configuration you should have total visibility into the performance of your hosts and applications thanks to Convox and Datadog! If you haven’t deployed an app with Convox before we make ECS super easy. You can signup for free and have your first app deployed in a few minutes.

